Here at nClouds, when we onboard a new Site Reliability Engineering (SRE) customer, our SRE team conducts an onboarding workshop that explains SRE concepts. We collaborate with the customer during the workshop to discuss how to define, measure, and track availability and user happiness, including:
- Defining SLIs (Service-Level Indicators), the metrics that measure compliance with SLOs (Service-Level Objectives, such as uptime or response time).
- Setting up monitoring and observability to provide rapid response to alerts to reduce MTTD (Mean Time To Detect) and MTTR (Mean Time To Recover).
- Setting up an automated runbook and documentation.
- Establishing an incident management process (procedures and actions taken to respond to and resolve critical incidents).
Defining SLIs and SLOs
When setting SLOs, it’s unrealistic to set a reliability target at 100%. Complex systems operating at scale are going to have failures. And, even if it were possible to achieve 100% reliability, the time spent achieving it would have an adverse effect on innovation and the speed of delivering new features. It’s critical to balance feature development with platform stability. So, to set realistic SLOs and SLIs, we determine with our customers what level of errors is acceptable to meet user expectations and support business objectives.
Once we set up the SLO targets, the remaining budget is called the Error Budget, based on how much time you’re willing to allow your systems to be down. It is calculated as 100% minus the SLO target percentage. If our SLO target is 99.9%, our error budget is 100% – 99.9% = 0.1%. The SRE team only affords downtime equal to the error budget.
One of the best practices to define SLIs and SLOs is to set SLIs against system boundaries. A system boundary is the point at which one or more components are exposed to external consumers.
In modern complex systems, a platform consists of hundreds of components. Therefore, defining an SLI for every component is not feasible. Instead, group elements of your platform into systems and define their boundaries.
Let’s use a real-life example of helping a customer set up realistic SLOs. It all starts with a journey.
The SRE journey of “Customer A”
We began the journey with Customer A by asking some foundational questions during the SRE onboarding workshop to develop a concrete set of SLOs and SLIs:
- What does system availability mean to you?
- What does system reliability mean to you?
- How do you define user happiness?
- What levels of system availability and reliability do you require to deliver user happiness?
Click here to learn more about the nClouds Site Reliability Engineering workshop.
During the SRE onboarding workshop, we learned the customer’s parameters for availability, reliability, and customer happiness. They wanted their API endpoint to be available with a low response time and no errors.
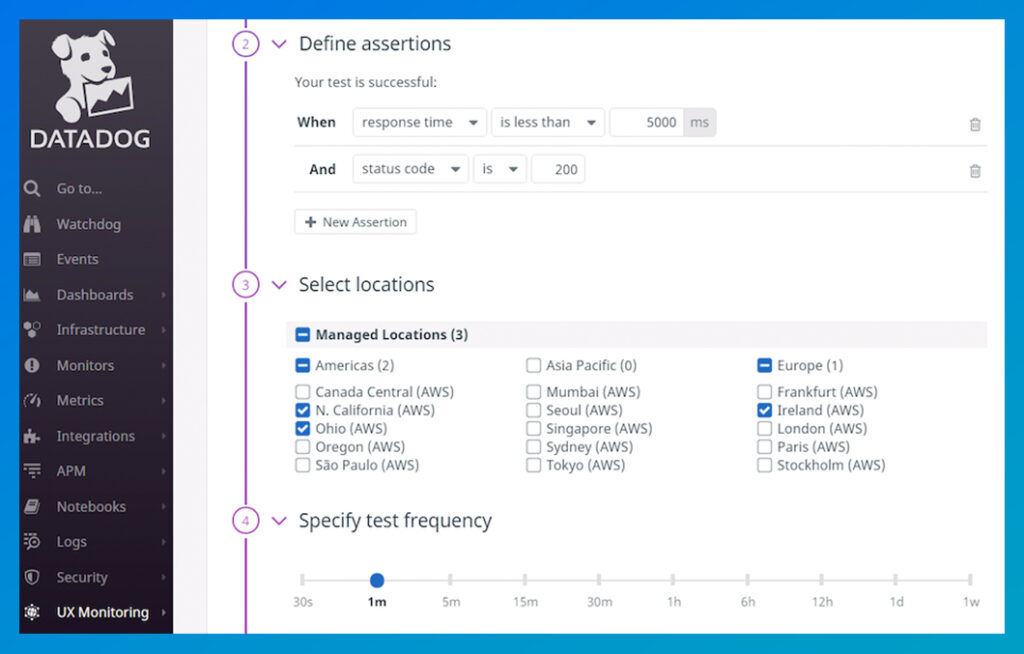
Based on those parameters, our SRE team started working on converting the parameters into metrics. We determined that the API endpoint should be available with an HTTP status Code 200 (meaning that the request has succeeded) at five major worldwide locations and the response time should be below 5000ms.
We used Datadog Synthetic Monitoring to perform tests on the required parameters of the API endpoint with a test frequency of 1 minute.

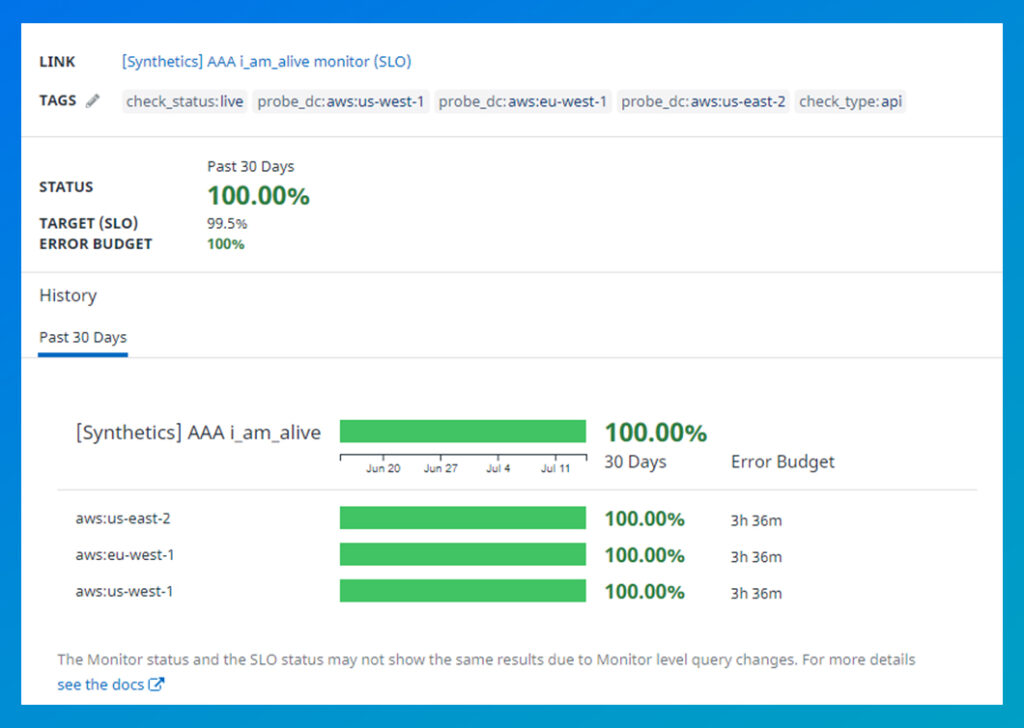
After brainstorming, we decided to set the SLO target at 99.5% for 30 days, resulting in an error budget of 0.5%. With the help of the Datadog dashboard SLO widget, we tracked the SLO and error budget.

Are you having challenges with system availability and system reliability?
To learn more about nClouds’ SRE Services, contact us today. We’d love to work with you to define the right SLOs and SLIs for your applications.

View this on-demand webinar featuring SRE experts from nClouds & Datadog
How DevOps Teams Use SRE to Innovate Faster with Reliability.


